Sensing Devices

Hardware Options To Meet Your Site's Dynamic Lifecycle.

Every facility is different. Integrate sensors based on environment, detection thresholds, cost, and compliance requirements.

methane measurement solutions

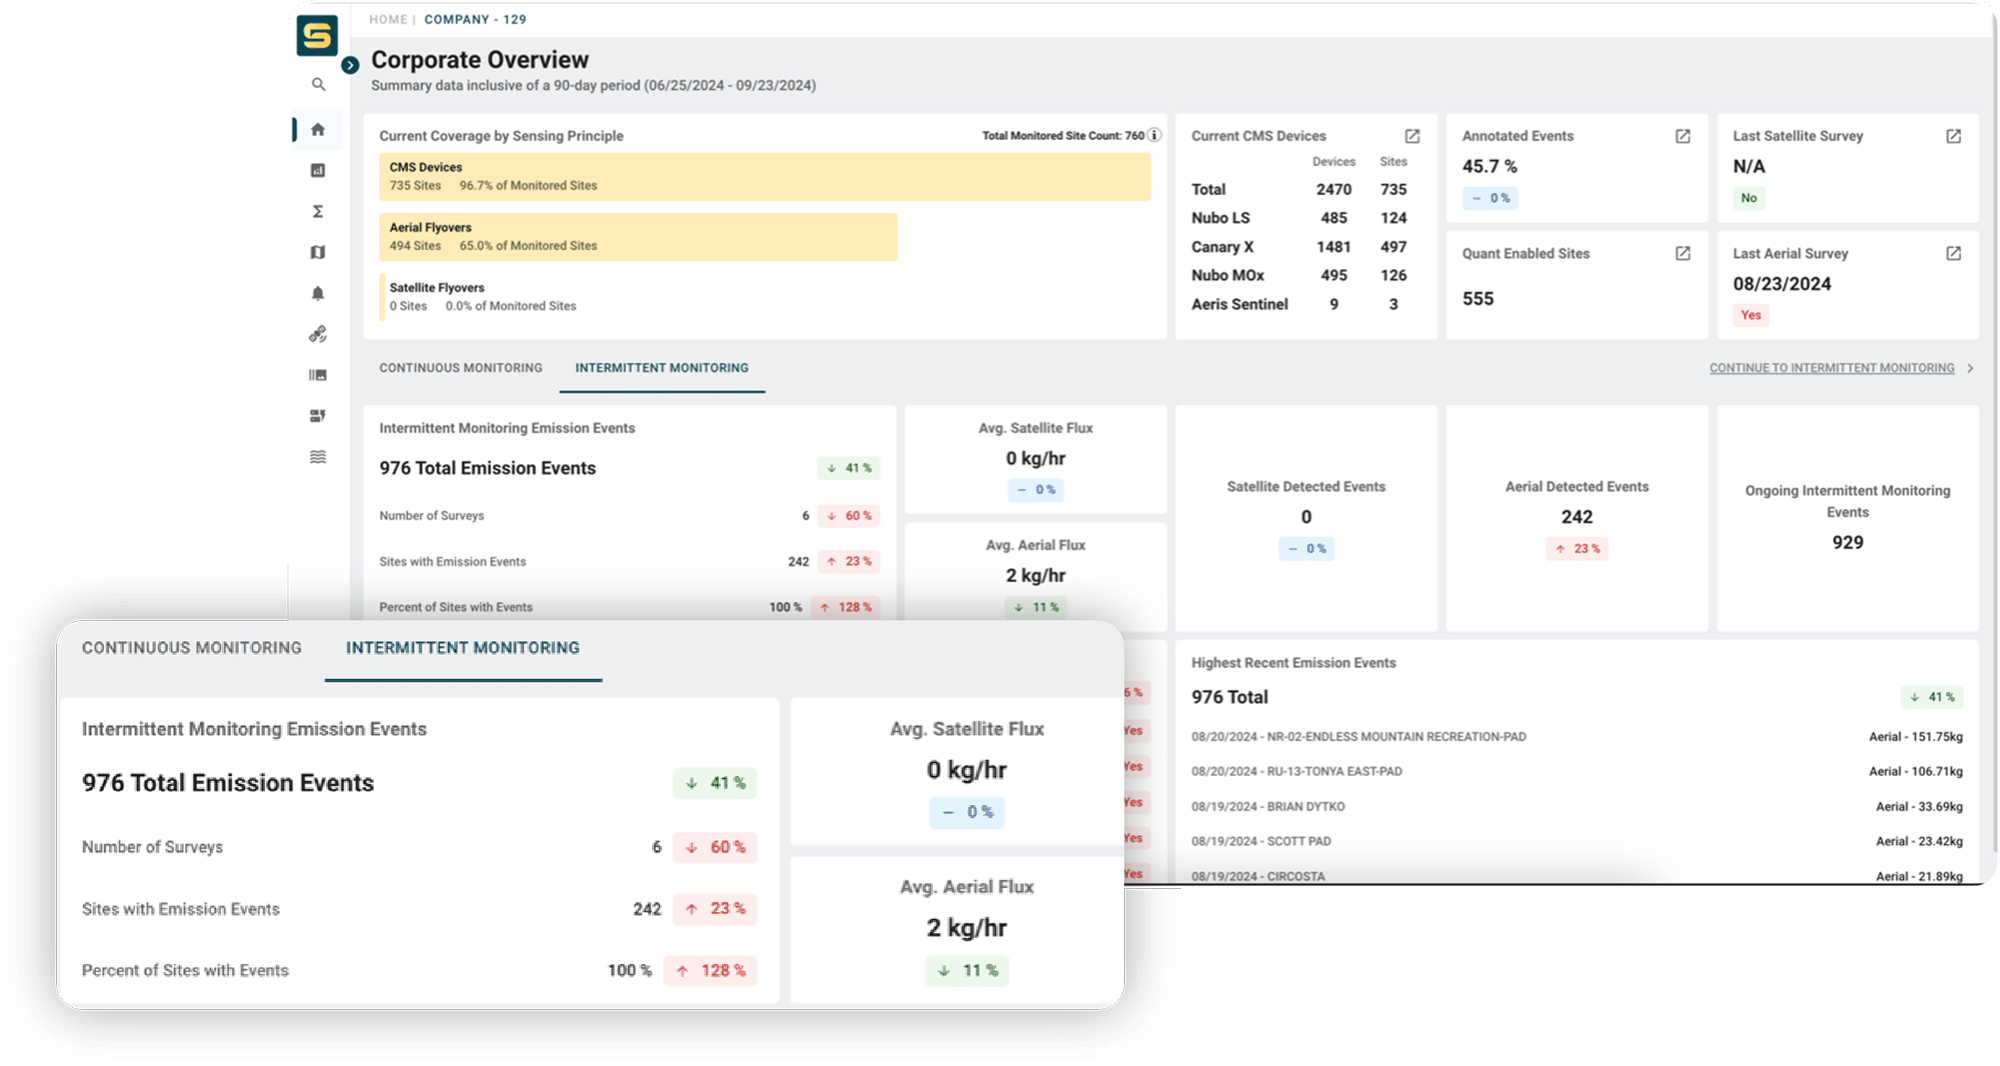
The Project Canary SENSE Platform creates an integrated view of your sensor array that relies on your hardware choices. We match-make hardware solutions (including 3rd parties) to help you meet your data and reporting requirements, including Canary X, Canary S, Sensirion Nubo, and more.

flat top montain skyline
rough seas

Don't See Your Sensor Hardware Listed?

Ask Us About Data Ingestion And Api Integration.

Technology Goes To Work

The Canary X is specifically designed to track methane emissions. With industry-leading sensitivity, measurement frequency, and accuracy, the Canary X allows for the localization and quantification of emission sources, enabling you to catch and remediate leaks faster than ever.

Designed to track VOCs, Canary S is a continuous solar-powered air quality and meteorological monitoring system designed to be class-leading in size, reliability, and flexibility. With cellular communication, these systems can be placed nearly anywhere to provide measurements of particulate matter, targeted gases, and meteorological data.

With next-generation metal oxide technology, the Sensiron Nubo Sphere is an affordable, reliable, scalable sensor. Designed for versatility and ease of maintenance, Nubo Sphere features an exchangeable cartridge system and performs well across tougher operating environments and climates. Data collected from the Nubo Sphere integrates seamlessly with Project Canary’s innovative emissions platform.

Every Canary S unit comes with the capability to add an auto-triggered summa canister. Operators can pull high-quality samples and receive lab-grade analysis and speciated VOC at PPB levels for a fraction of the price of utilizing an expensive GC unit.

The Canary Difference

Integrated data streams to reconcile and aggregate emission information.

checkmark icon

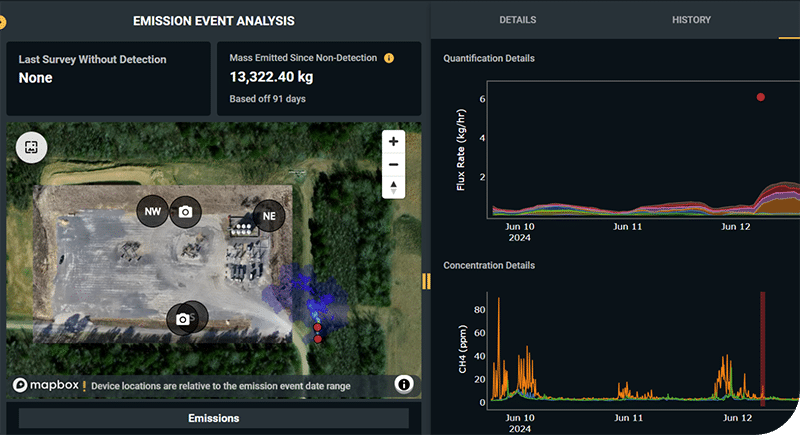
Emission Source Heatmap

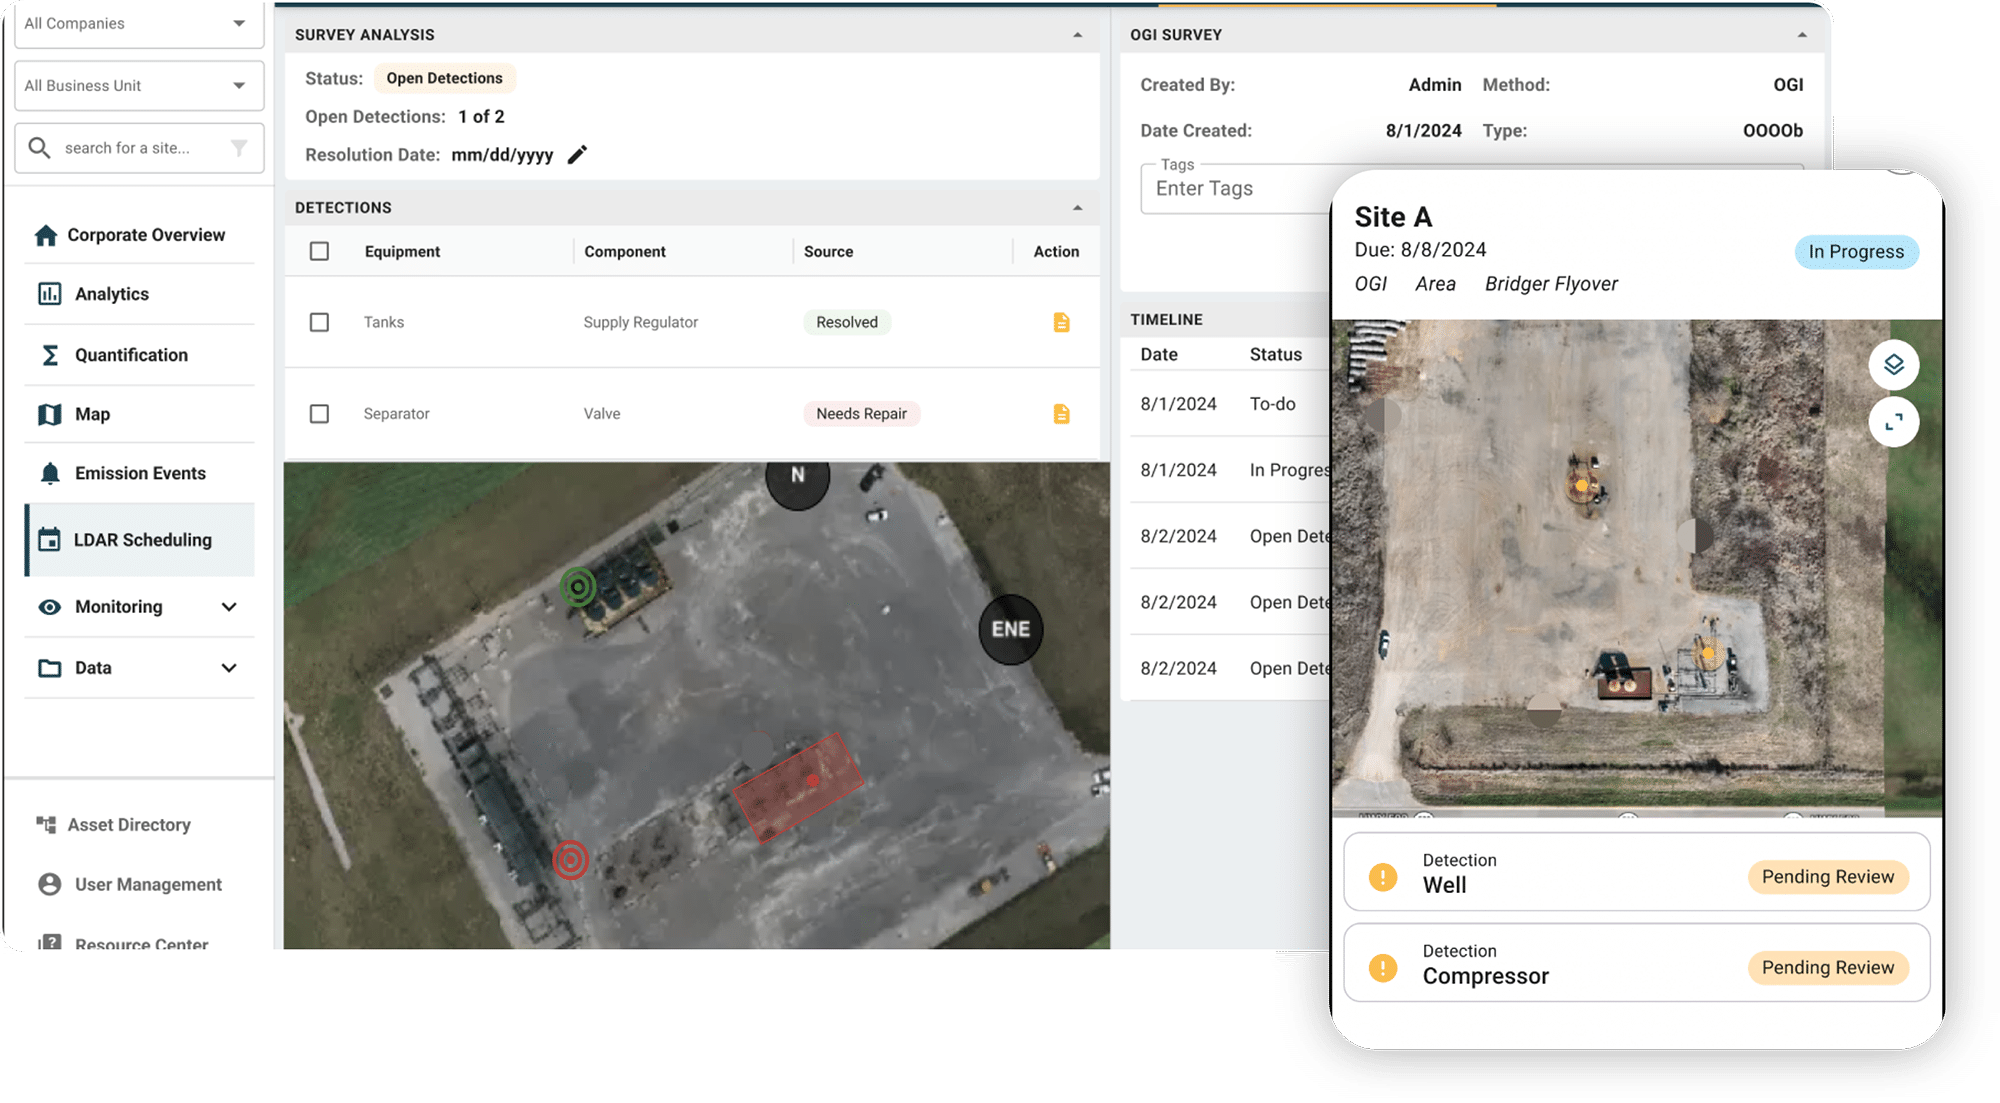
Make your LDAR teams more effective and give your ops team the ability to see the location and severity of emissions in near real-time.

checkmark icon

Methane Emissions Quantification

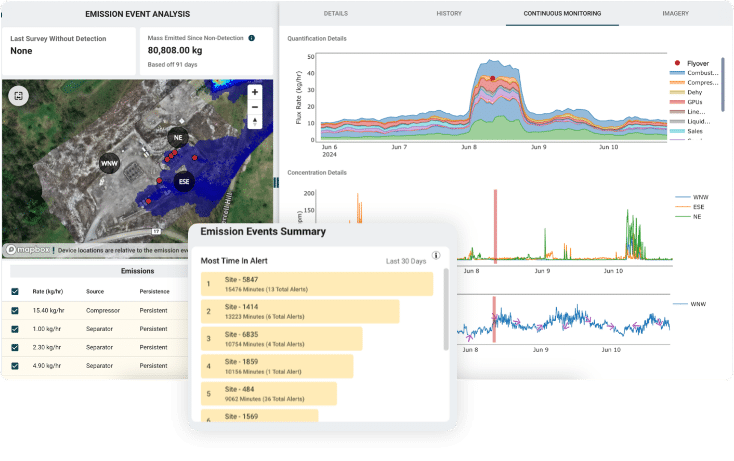
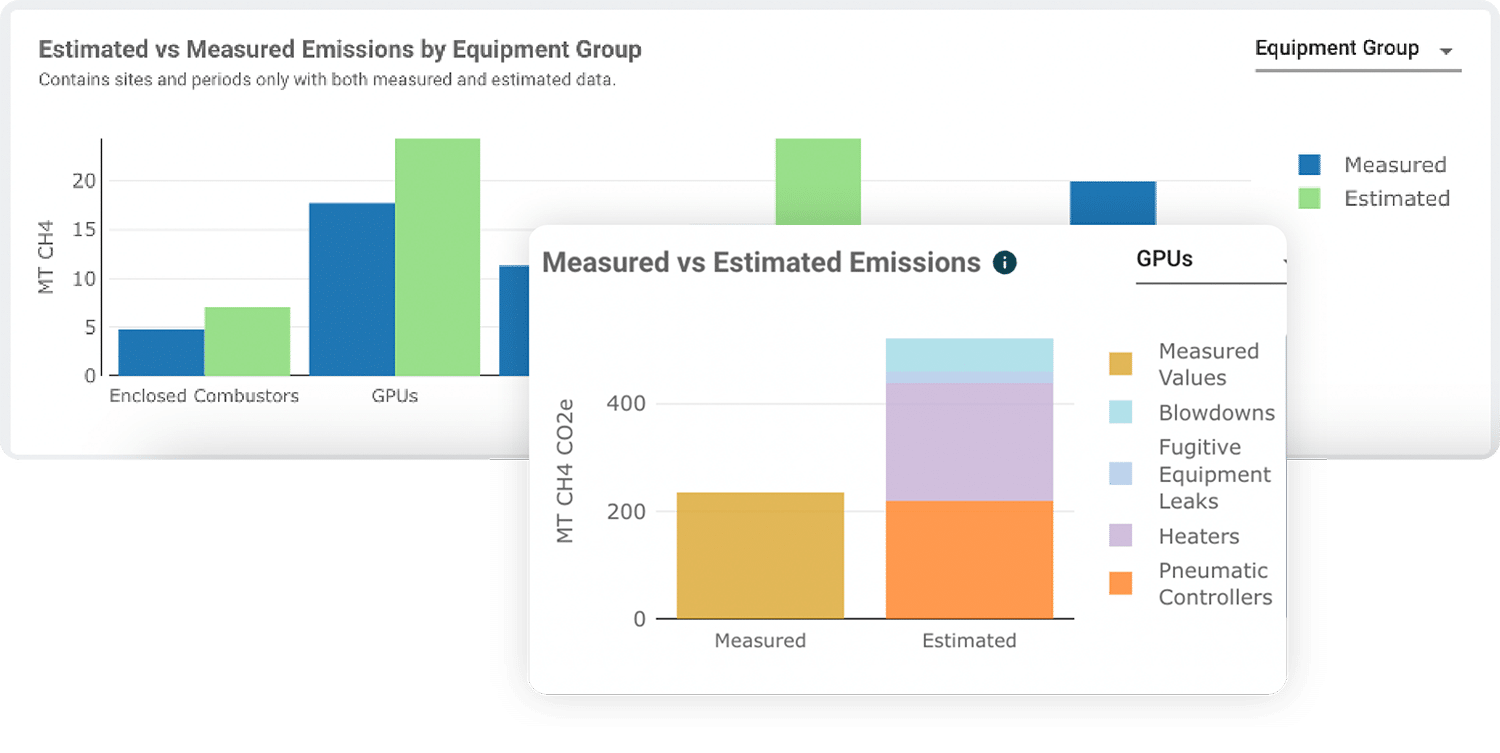
Leverage artificial intelligence to accurately quantify emissions with fluxes far below 0.1 grams per second and identify emission source attribution at the equipment group level.

checkmark icon

Emission Source Attribution

Localize emission sources in Project Canary’s dashboard. The source attribution feature determines the most likely emission source for a given completed alert.

checkmark icon

Greenhouse Gas Ghg Readings

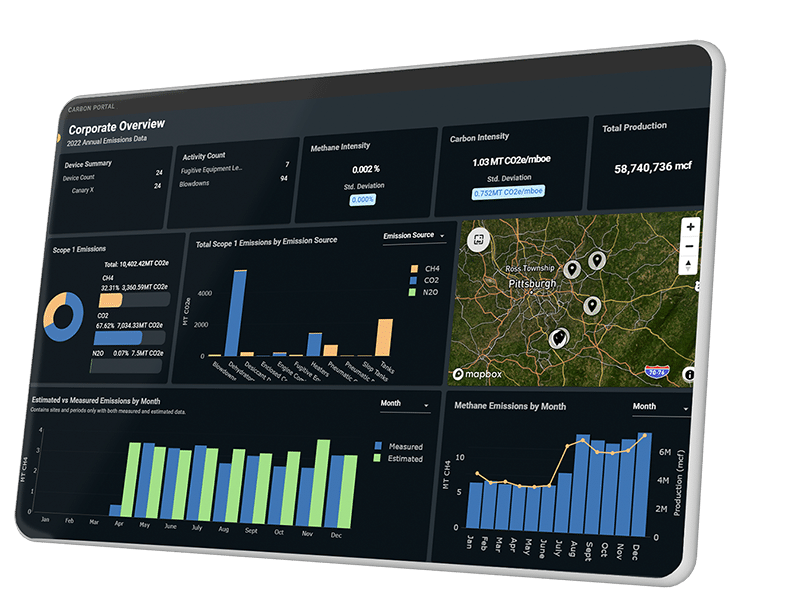
Chart greenhouse gas emissions over time to identify leaks and emission-intensive equipment. Demonstrate and improve the success of your emission reduction programs through real-time data.

checkmark icon

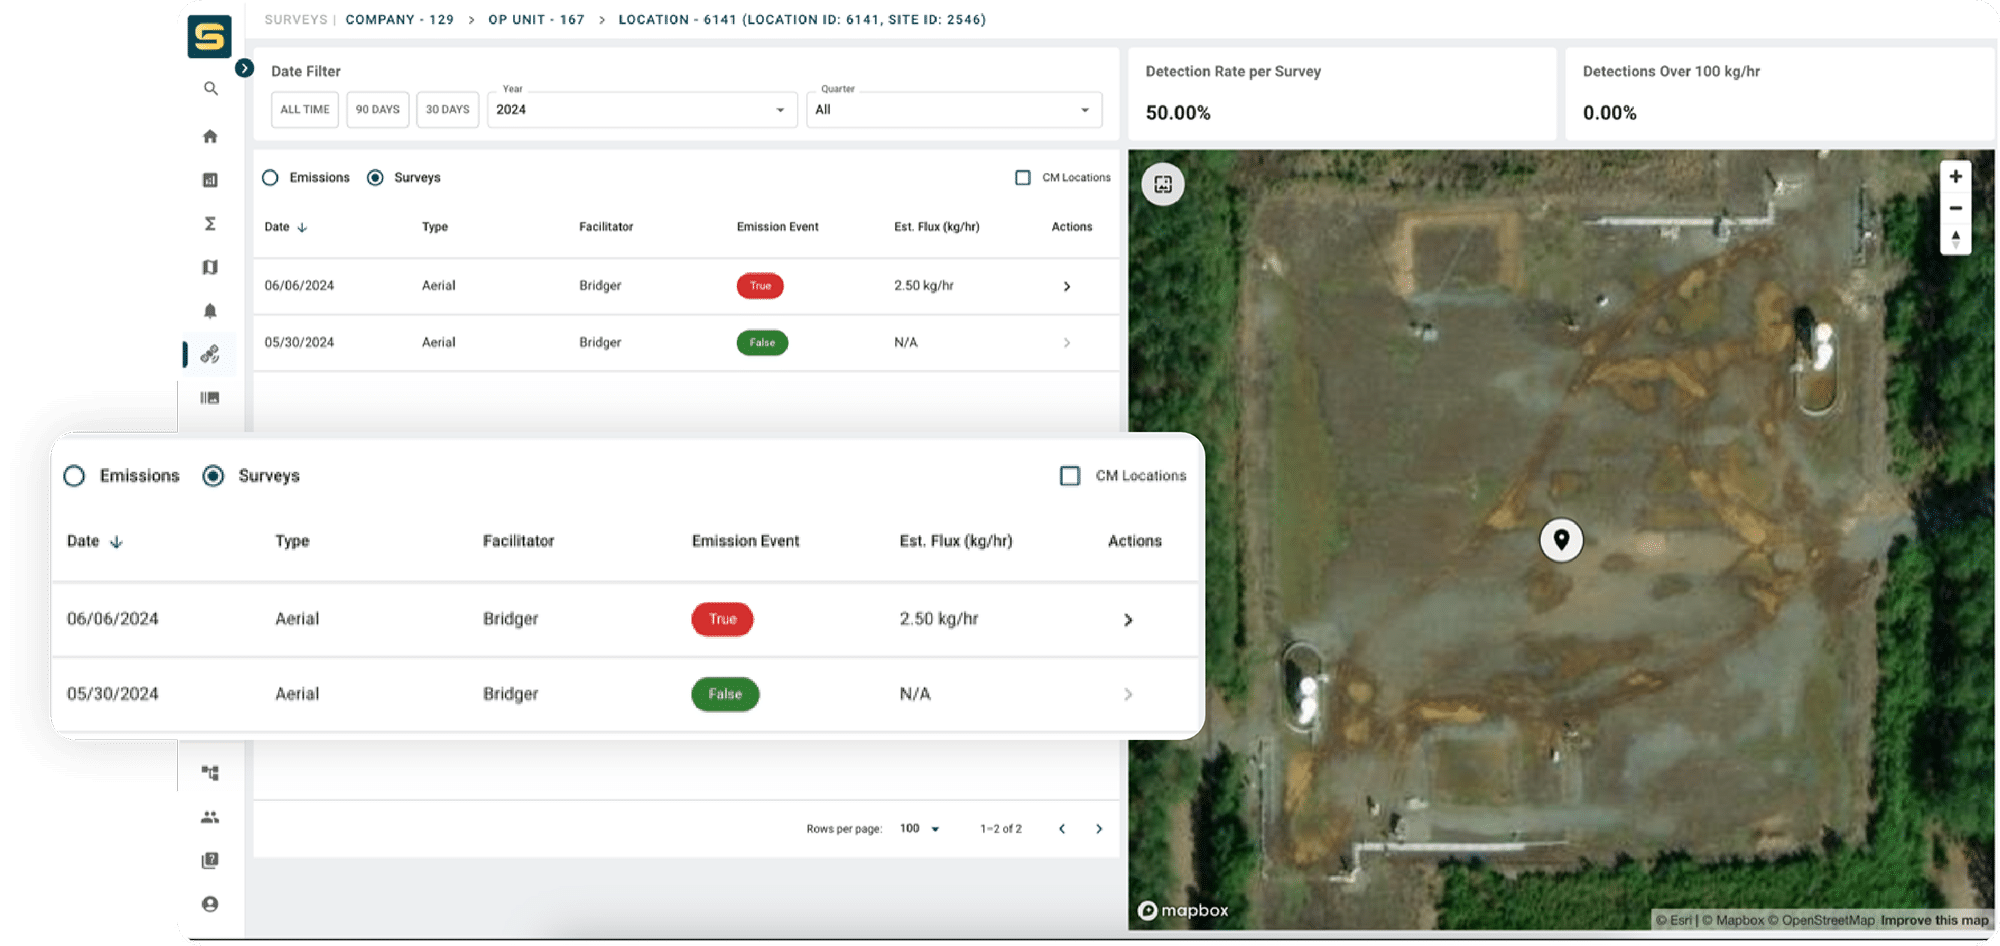
Facility-Level Drone Imagery

View the physical attributes of your site alongside other data sources to catch and stop leaks.

checkmark icon

Wind Speed & Direction

Correlate wind and pollutant data with asset location, allowing you to pinpoint the exact site of a leak and delineate on and off-site emissions.

Contact Us

"*" indicates required fields

Name*
This field is for validation purposes and should be left unchanged.

Scroll to Top