Project Canary has released the newest version of our Quantification model (version 2.5). In addition to ongoing testing with METEC, Project Canary participated in a controlled release study in the Fall of 2022 to further test and refine our model for high release rates. During testing at release rates from 20 kg/hr to 7,000 kg/hr, the plume rise effect was prominent. As a result, Project Canary’s quantification model was updated to factor in the buoyancy of methane. To quantify total site emissions with the highest level of accuracy, we have implemented and released the updated model to account for the effect of plume rise at higher emission rates.
What is Plume Rise?
Plume rise is a combination of the gases’ momentum and buoyancy that causes the gas to rise above the ambient air. Incorporating the vertical axis into the plume increases the accuracy of our quantification model, especially at higher release rates. This phenomenon is well-documented, and there are multiple academic studies describing this effect. Our model utilizes the Briggs Plume Rise Equations.[1] See below to visualize the effect of plume rise with different release rates.
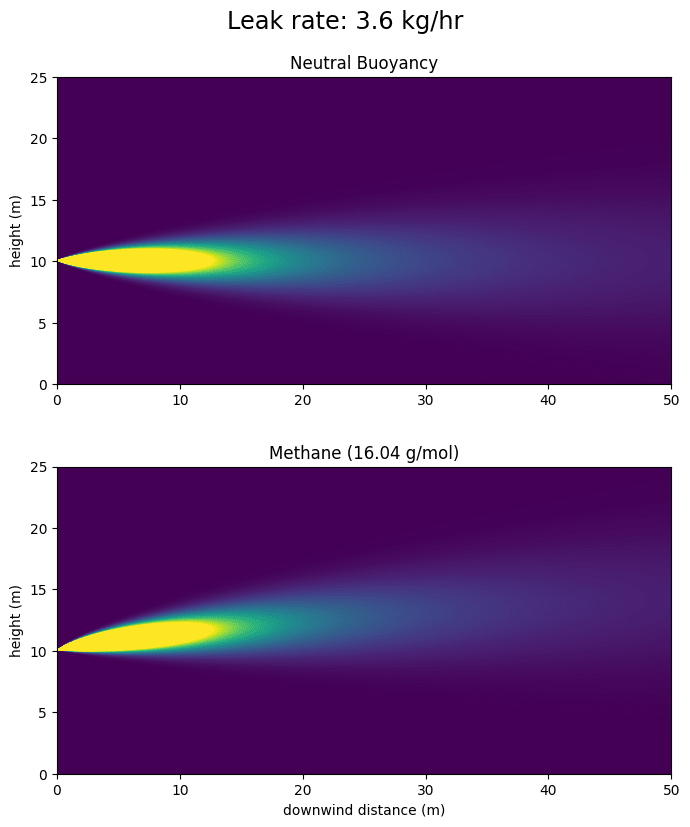
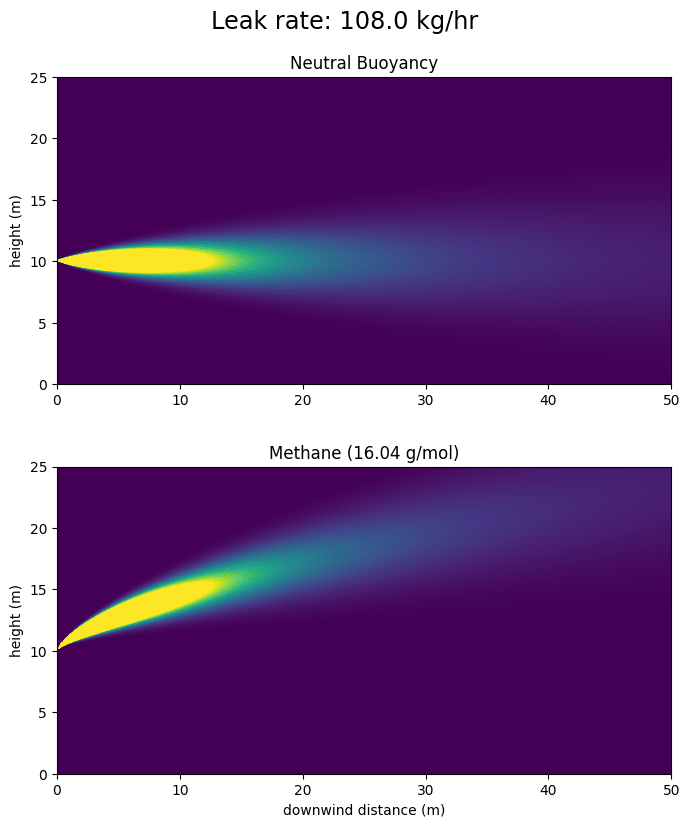
Figure 1: Effect of plume rise at a low leak rate (3.6 kg/hr) and a high leak rate (108.0 kg/hr)
How does plume rise affect quantified values?
The observed impact on quantified values ranges from negligible to a 263% increase from values under Quantification version 2.0. The impact will be negligible at lower release rates and on sites with persistent, low-rate emissions due to minimal plume rise, resulting in behavior similar to a neutral buoyancy plume.
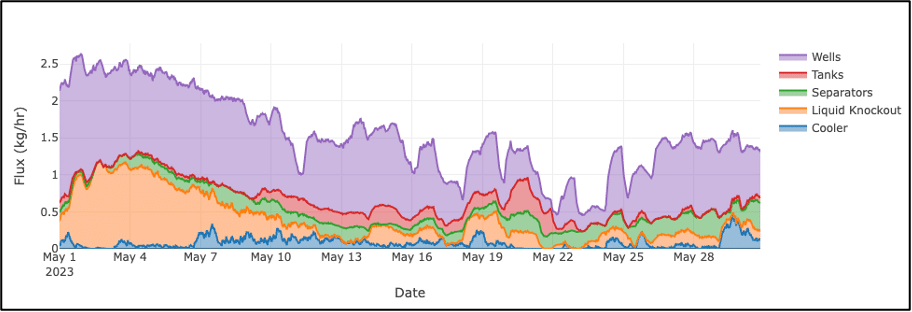
Figure 2: Quantification 2.0 – Low Emissions Site
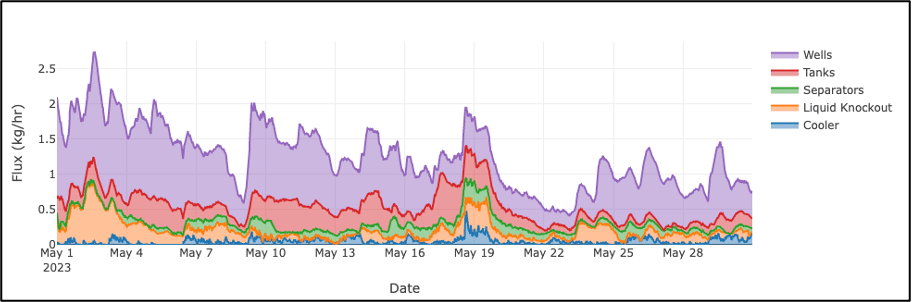
Figure 3: Quantification 2.5 – Low Emissions Site
At higher emitting sites, such as compressor stations, the effect is substantial. This is due to modified plume behavior observable at higher emission rates.
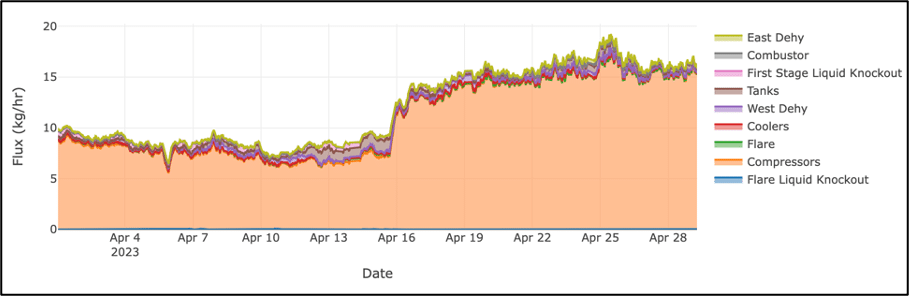
Figure 4: Quantification 2.0 – High Emissions Site
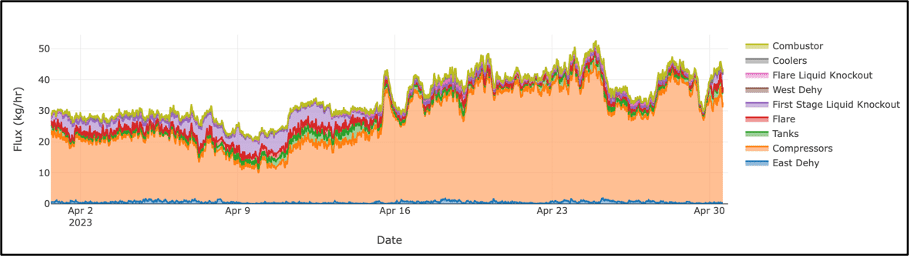
Figure 5: Quantification 2.5 – High Emissions Site
The impacts of Quantification v2.5 can also be observed on lower-emitting sites that experience intermittent events with a higher emission rate. For example, when an individual fugitive emission occurs, such as a blown pressure release valve on the tanks, the quantified emissions for that time period are 3X what they were before. Still, the other time periods remain consistent due to the lower rates observed in the site’s persistent emissions.
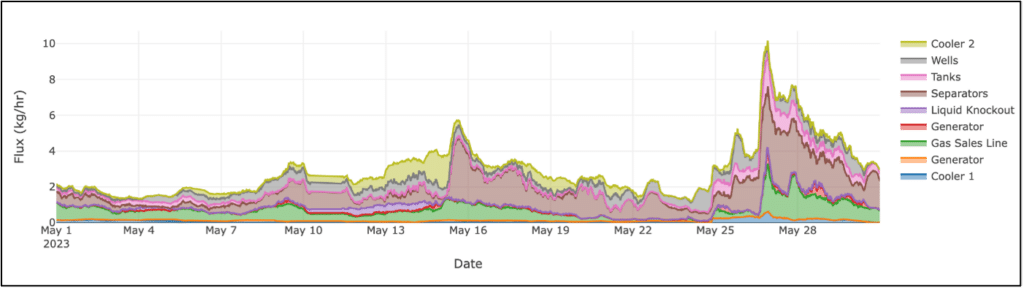
Figure 6: Quantification 2.0 – Intermittent high emission rate
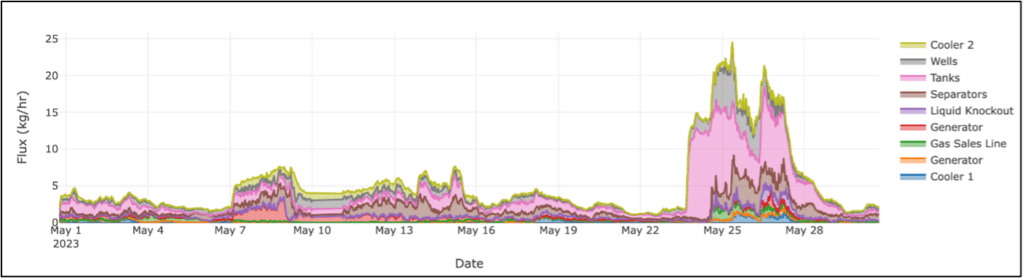
Figure 7: Quantification 2.5 – Intermittent high emission rate
Project Canary is committed to constantly improving the accuracy of our quantification model. We will continue to partner with academic institutions for controlled release testing of different emissions scenarios to understand areas for improvement and implement new versions of our model. We are already working on our next version and look forward to sharing the details when released.
References:
[1] https://www.envis.org/technology/air-pollution/951-briggs-plume-rise-equation